
“Far more money has been lost by investors preparing for corrections, or trying to anticipate corrections, than has been lost in the corrections themselves.” — Peter Lynch
To understand the present one needs to look into the mirror of past. But what if the mirror is skewed or broken. Open any news channel today and you will hear a confident voice explaining the fall. Oil. The Fed. Foreign investors. The rupee. Too many IPOs. A feared RBI rate hike. Each expert is sure. Each expert is different.
That is the real story of this market. It is not only falling. It is falling without a single villain, and that is what makes it scary.
-2%“It’s OIL!”“It’s the FED!”“FIIs selling!”“Weak RUPEE!”“AI has the cash!”“RBI rate hike!”“Buy the dip!”Investor: “…can all of you be right?”
The scoreboard
First, the facts as of the first week of October 2026.
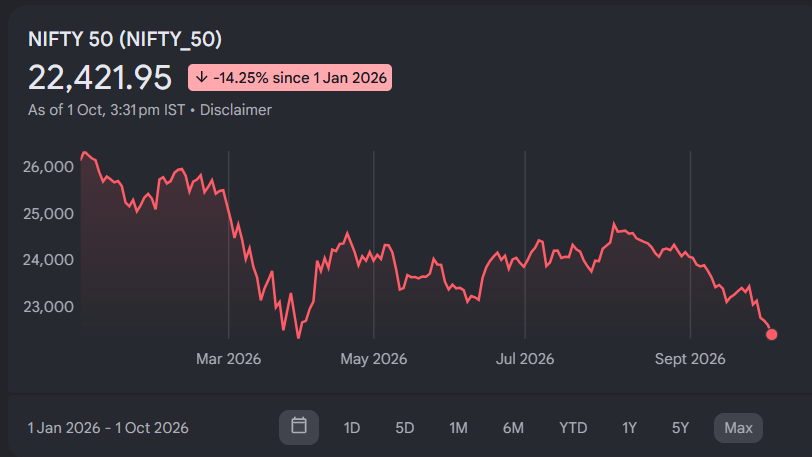
Nifty touched a record close near 26,300 on 2 January 2026. By 1 October it had slipped to about 22,400, a fall of roughly 14% in rupee terms. The chart tells the story: a sharp drop into March, a half-hearted recovery by the summer, and then a fresh slide through September, back to the lows of the spring.
Seven suspects, no confession
Here is the key insight, and why this feels worse than a normal dip. Oil threatens the earnings. Bond yields reduce the price people will pay for those earnings. Both are happening together. Investors get hit on the “E” and the “P/E” at once.
The elephant in the room: the AI vacuum cleaner
Most explanations of this fall are about what is going wrong in India. The bigger driver may be what is going right somewhere else.
For two years the world has had one favourite story: artificial intelligence. And the companies that own that story are mostly American (the chip designers, cloud giants and model builders) or sit in the AI supply chain in Taiwan and Korea (TSMC, Samsung, SK Hynix). India has few of them. So when a global fund manager wants AI exposure, India is not on the menu. Worse, to buy more AI, he has to sell something else. Emerging markets are the easy sale.
Emerging markets (incl. India)$$$$$$AIUS · Taiwan · Korea
Here is what the numbers say:
Now connect this to the rest of the post. The AI pull works together with the other suspects. High US bond yields make the US more attractive. A weak rupee makes foreigners’ losses worse. Pricey oil hurts India directly. Each one pushes money out. AI is why it has nowhere to come back to.
Notice what is absent: a single bad quarter. Even in the strong months, a large part of the foreign selling had little to do with Indian companies. India was not sold because it failed. It was sold because something else shone.
We have seen this movie, too
This is the 1999-2000 plot. Then, the “new economy” was the internet. Global money crowded into US tech, and emerging markets, India included, were starved of attention. When the bubble burst in 2000-02, the money did not stay in America. Over the next several years it went looking for cheaper growth, and emerging markets had one of their strongest runs (roughly 2003-07). It is only a parallel, not a promise. But it shows the direction of the flow can reverse, and fast.
There are early hints of confusion on this front too. In February, reports said US investors were shifting money into emerging markets at the fastest pace in five years. And around the middle of the year, a roughly 5% dip in the Nasdaq made some analysts wonder whether a cooling AI trade could bring foreign money back to India. The story is not settled. It never is.
A twist: the rupee hides the real damage
Nifty hit a new high in rupees in January. But the rupee had already fallen, so for a dollar investor it was still below the September 2024 peak. Measured in dollars, the fall from that peak is about a quarter, according to one trader’s widely shared calculation.
We have seen this movie before
The title changes every time. The plot barely does. Look at the major falls of the last 18 years, how deep they went, and how long the market took to climb back to its old peak from the bottom.
Now the part that should bother you. Four ingredients keep returning, and 2026 has all of them:
| Oil spike | Strong dollar / US rates | FII exit | Rupee slide | |
|---|---|---|---|---|
| 2008 | ✔ | ✔ | ✔ | ✔ |
| 2013 | – | ✔ | ✔ | ✔ |
| 2018 | ✔ | ✔ | ✔ | ✔ |
| 2022 | ✔ | ✔ | ✔ | ✔ |
| 2026 | ✔ | ✔ | ✔ | ✔ |
Today there is a fifth ingredient the earlier falls did not have in this form: an AI boom pulling global money towards the US. In 2013 the rupee was breaking records and the RBI was fighting to defend it. In 2018 it was oil plus the Fed plus an NBFC scare. In 2022 it was oil plus the Fed. Today it is the same cast with new faces. The cause changes. The pattern, and the fear, do not.
And in each one, the confusion was the same: “this time it’s different.” It was never that different.
“SELL!!”“SIP on.”2008201320202026: you are here
What history whispers
If you run SIPs, keep them going. Falling markets are when each rupee buys more units.
If you have idle money and a 5-10 year horizon, stagger it in. Do not wait for “clarity”. Markets never announce that the danger is over.
If you are fully invested, check your portfolio less. The plan is being tested. That is not the same as failing.
Only the investors who stay solvent and calm get to see how this story ends, as they did in 2008, 2013, 2020 and 2022.
Everyone has a plan till they get punched in the face. Staying is uncomfortable. Which is why most people leave.
Will you?