
“Confronted with a like challenge to distill the secret of sound investment into three words, we venture the motto, Margin of Safety.”- Ben Graham
October 2026 | The fall of India’s most trusted consumer businesses, the return of an old market cycle, and the search for a valuation bottom.
For decades, Indian investors have treated FMCG stocks as the financial equivalent of a concrete bunker. The economy could slow, interest rates could rise, geopolitical tensions could escalate, and small-cap stocks could collapse—but people would still buy toothpaste, detergent, biscuits, soap and shampoo.
After all, nobody postpones brushing their teeth because the Nifty has fallen 10%.
That logic made companies such as Hindustan Unilever, Nestlé India, Britannia and Dabur the preferred destinations for investors seeking predictable earnings, strong brands and dependable cash flows.
If Indians continue buying everyday products, why are FMCG stocks behaving as if the consumer has disappeared?
The answer lies in the difference between selling a product, growing its sales volume, earning a profit and justifying the price investors pay for that profit.
The Great FMCG Paradox: The Sector Is Selling Products, but Losing Market Confidence
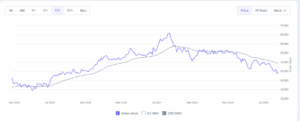
By September 23, 2026, the Nifty FMCG index had declined approximately 18% during the year, compared with a 6.5% fall in the Nifty 50. ITC was among the major drags, with a decline of approximately 34%, while Godrej Consumer Products, Emami, Patanjali Foods, United Breweries and Dabur had also suffered substantial losses.
There are six major reasons behind the sector’s struggles.
The six forces hurting FMCG stocks
1. Weak mass-market consumption
Rural and lower-income urban consumers have faced pressure from food inflation and other essential expenses. When household budgets get squeezed, consumers often switch to smaller packs, cheaper brands or local alternatives. This hurts volume growth and premium product sales.
2. Input-cost inflation
Palm oil, crude-linked packaging, coffee, cocoa, milk and other commodities can raise production costs. Companies sometimes increase prices to protect margins, but higher prices can reduce volumes. When costs rise faster than selling prices, margins get squeezed.
3. Premium valuations came under pressure
FMCG stocks were historically treated as defensive, predictable compounders. Investors often paid 50–70 times earnings for some premium businesses. If earnings subsequently grow at only 6–10% annually, those valuations become difficult to justify.
4. Competition increased
Regional brands, value-focused products, direct-to-consumer companies and quick-commerce platforms have changed the competitive landscape. Established companies must spend more on advertising, distribution and product innovation to defend their market share.
5. Revenue growth did not always translate into strong earnings growth
Price increases can lift reported sales even when consumers buy fewer units. Meanwhile, advertising expenses, distribution investments and commodity costs can absorb much of the benefit. Investors increasingly want genuine volume-led growth, not just price-led growth.
6. Money moved towards faster-growing sectors
During much of this period, investors found stronger growth opportunities in capital goods, manufacturing, defence, infrastructure and some financial businesses. FMCG companies consequently lost some of their valuation premium relative to other sectors.
Look at the below Chart of major FMCG companies Net profit VS Share Price for last 5 years:
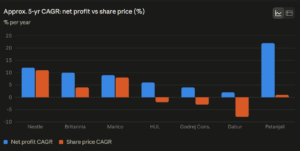
| Company | Net profit, 5-yr CAGR (approx.) | FY26 profit growth (YoY) | Share price, 5-yr CAGR (approx.) | Earnings vs price |
|---|---|---|---|---|
| Nestle India | ~12% (CY21 ₹2,118 Cr → FY26 ₹3,499 Cr, 4.25 yrs) | +9% | ~11% | Price roughly tracked earnings |
| Britannia | ~10–11% | EPS +16% | ~4% | Large gap, strong earnings but price de-rated |
| Marico | ~9% (₹1,172 Cr → ₹1,813 Cr) | +9% | ~8% | Price tracked earnings |
| HUL | ~6% (underlying) | +41% reported, one-off inflated | ~-2% | Earnings grew, price fell |
| Dabur | ~2% (₹1,695 Cr → ₹1,869 Cr) | +7% | ~-7% to -10% | Stagnant earnings, price fell sharply |
| Patanjali Foods | ~22% (FY22 ₹806 Cr → FY26 ₹1,814 Cr, 4 yrs) | +39.5% | ~0 to +2% | Largest gap, profit surged but price flat |
To understand the asymmetricity between earnings growth and share price. We need to understand that share price are made of two components. Earning per share(EPS) and Price to Earnings ratio(PE multiple). Below chart shows the 5 years PE ratio chart of NIFTY FMCG index:
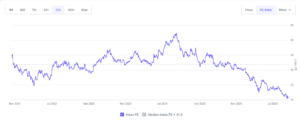
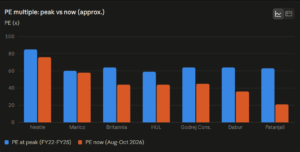
Since, the EPS growth has been unable to justify the exorbitant PE ratios these companies had commanded in the past. the market has severely derated the PE ratio of these companies(evident in above chart).
But do remember that the market moves in cycles and while the last five years may have been disappointing for FMCG shareholders, but that does not automatically mean the next five years will be. The opportunity depends on whether earnings recover while valuations become more reasonable—not simply on stock prices falling.
A useful historical parallel is the FMCG sector’s experience after the 2013–14 slowdown and during the pandemic-led disruption of 2020. Demand pressures, cost inflation and changes in consumer behavior can temporarily squeeze growth and margins. When volume growth returns, input costs ease and earnings estimates improve, markets can reassess what they are willing to pay for those earnings. But you do need to do your due diligence on each share before taking the call.